Carte interactive des migrations
Cette carte est tout de même à prendre avec précautions en raison de certaines erreurs qui ont été relevées et mentionnées
- Comment confondre Lagos et Abuja au Nigeria?
- Abidjan confondu avec Yamoussoukro, les capitales politiques figurent en lieu et place des capitales économiques qui drainent les migrants…
- Lagos et Abidjan n’apparaissent pas …
Merci de signaler d’autres erreurs éventuelles
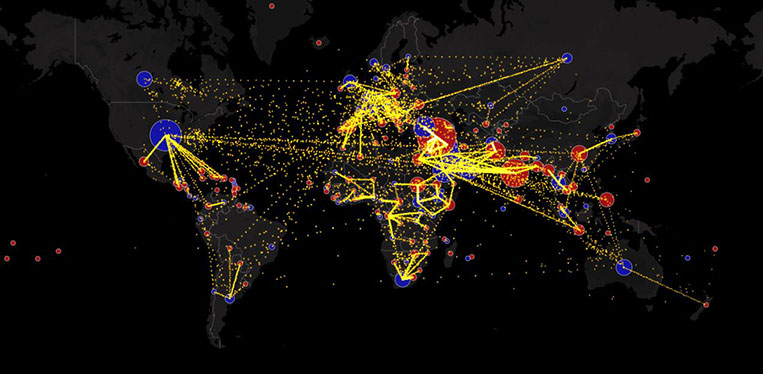
Based on data from the U.N. Population Division, this map shows the estimated net migration (inflows minus outflows) by origin and destination country between 2010 and 2015.
Blue circles = positive net migration (more inflows). Red circles = negative net migration (more outflows). Each yellow dot represents 1,000 people.
Hover over a circle to see that country’s total net migration between 2010 and 2015. Click a circle (or tap twice on mobile) to view only the migation flows in and out of that country.
For more info about this map, see the full post: All the World’s Immigration Visualized in 1 Map.
Created by: @galka_max